Lab 2 — Direct an AI to Clean a Dataset
Clean a messy journal-entry export by hand, then write the specification that gets an AI to do the same job.
What you hand in
Four files and three short written answers, all to the Lab 2 quiz. The quiz has a separate, labeled slot for each file, so you always know what goes where.
Name every file with your university ID first. Replace u1234567 below with
yours.
| Upload this | What it is | From |
|---|---|---|
u1234567_lab_02_workbook.xlsx | Your cleaned table and per-user count | Part 1 |
u1234567_lab_02_spec.mdor ..._spec.pdf | Your specification. Markdown or PDF, either is accepted. | Part 2 |
u1234567_lab_02_analysis.pyor ..._analysis.ipynb | The script the AI builds from your spec. Either format is accepted. | Part 2 |
u1234567_lab_02_explainer.html | The explainer the AI builds for you | Part 3 |
Your script also writes lab_02_cleaned.csv and
lab_02_user_counts.csv. Keep those two names exactly as written, because you use
them to check your work and the Output Validator expects them, but do not upload them.
Write your specification and your three quiz answers in your own files first, then upload or paste them in. A Canvas session can time out and lose what is in the box. A file you saved will still be there.
How the lab works
In Week 1 you learned to give an AI good context. This week you put that to work on a real, messy data file, and you do the same job twice.
First you clean the file by hand in Excel. That is slow, but the same steps on the same file give the same answer every time, so the count you end up with is one you can trust. Then you get the same result a second way, by writing a specification that directs an AI to build a Python script. The AI on its own is not reliable, because the same loose request can give a different answer twice. The specification is what pins it down, and the script it produces does the same thing every run.
Doing it by hand first is not busywork. It gives you the number you check the AI against. Part 3 then asks you to explain the script the AI built, because you are the one submitting its output.
- Part 1, do it. Clean the file by hand in Excel and count the journal entries for each user. That count is your by-hand result.
- Part 2, direct it. Write a specification, have an AI build a Python script from it, run the script, and check its count against Part 1.
- Part 3, understand it. Direct the AI to explain the script to you, in the way you learn best, until you can explain it yourself.
Get set up
These are posted with the lab in the Week 2 module. Open them before you start.
JEA Detail.txt, the data file. It is in the Week 2 module in Canvas, and there is a copy in the course data repository if you would rather pull it from there. Do not open it in Excel yet.- The Lab 2 specification template, which you fill in for Part 2. It follows the same pattern as your Week 1 spec document. Make your own copy and save it somewhere you control.
- Two reference pages and the Output Validator. An encoding primer, a pandas primer, and the Output Validator, a browser tool that checks your cleaned data for common mistakes. This page points you at each one when you need it.
Tools. Part 1 uses Excel with Power Query. Part 2 offers two ways to turn your specification into a working script, one in Google Colab with nothing to install and one on your own machine with local Python. Both are laid out in Part 2, and you pick whichever fits what you have.
Part 1 — Clean it yourself in Excel (25 points)
You will import JEA Detail.txt into Excel, strip out everything that is not
real data, and finish with a clean ten-column table plus a count of journal entries for each
user. Follow the steps as written, because Part 2 asks you to describe these same steps
precisely in your specification.
Power Query may be new to you. The steps below assume no prior experience with it, so do them in order. The Week 2 session also includes a short Power Query walkthrough.
Look at the file first
Before Excel, open JEA Detail.txt in a plain-text editor. VS Code if you have
it, otherwise Notepad on Windows or TextEdit on Mac. Just look. You are checking two things.
First, what is wrong with the data. See the list below.
Second, the file's encoding. Every text file has an encoding, meaning the system that turns stored bytes into readable characters. Your editor names it. In VS Code it is in the blue bar at the bottom right; in Notepad it is in the status bar at the bottom, second item from the right. You are looking for a short label such as UTF-16 LE, UTF-8, or ANSI. Write down exactly the one your editor shows, because this file is not the usual UTF-8. You need it in Part 2, and an import that assumes the wrong encoding fails before it reads a single row. If encodings are new to you, the encoding primer in the Week 2 module is a short read.
The file is a tab-separated export with several deliberate problems.
- A report header. Several lines at the top, including Company XYZ,
REPORT DATE, GENERAL LEDGER DETAIL, and a row of
====, before the real data starts. - A two-line column header. The column names are split across two rows. An upper line carries the longer labels (Account, Post, User, Transaction), and a lower line is the complete one (Account, Category, Date, Period, ID, and the rest). Only the lower line is the one to keep.
- Page-break rows. A handful of times in the data, the export inserts
two non-data rows where a printed report would break to a new page, a row of
====and a row reading PAGE 0002. They sit scattered through the data and have to come out. - Quoted, spaced amounts. The Amount values are wrapped in quotes and
padding spaces, with a thousands comma, so you get
" 50,000.00 "instead of a clean number. - A hidden character in the ID column. Some ID cells begin with an
invisible non-printing character, a stray line break. The value displays as blank or
pushed out of place, so the user looks like missing data. Excel's
CLEANfunction removes these characters.TRIMdoes not, becauseTRIMonly removes spaces.
Underneath all of that are ten real columns: Account, Category, Date, Period, ID, Manual, Description, Number, Location, Amount.
- File, then Import, then Upload. Set the separator type to Tab, and turn off "Convert text to numbers, dates, and formulas" so the Amount values survive the import intact.
- Delete the report header rows at the top, and delete the upper of the two header lines. Keep the complete one.
- Add a filter, filter the Category column to blanks, and delete the rows it finds. Those are the page-break rows.
- Clean Amount into a new column with
=VALUE(TRIM(SUBSTITUTE(SUBSTITUTE(J2,CHAR(34),""),",",""))), pointing at your Amount cell. - Clean ID into a new column with
=CLEAN(TRIM(E2)), pointing at your ID cell.TRIMalone will not do it. - Data, then Pivot table. Put the cleaned ID in Rows and again in Values, summarized by COUNTA.
- Download as
.xlsxwith File, then Download, then Microsoft Excel.
1.1 — Open Power Query and point it at the file
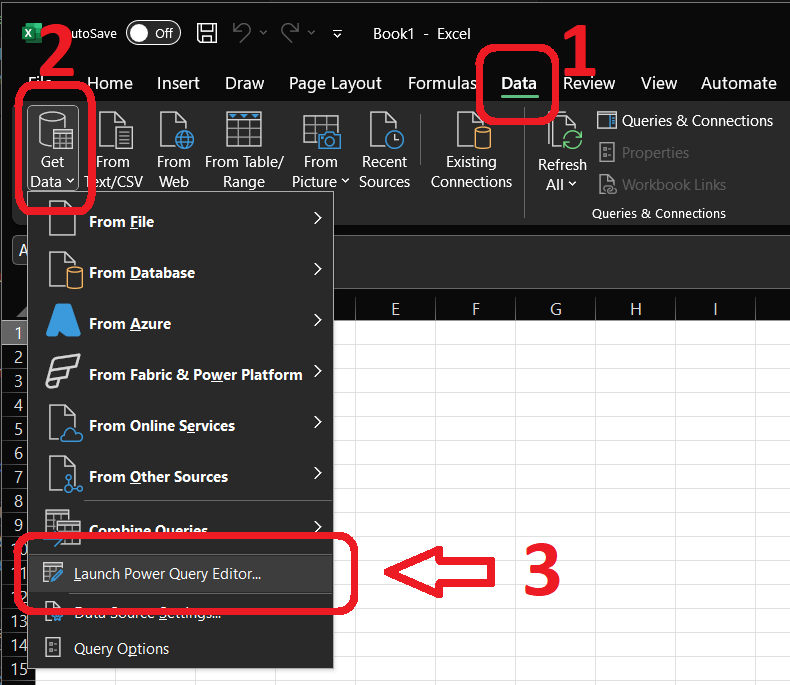
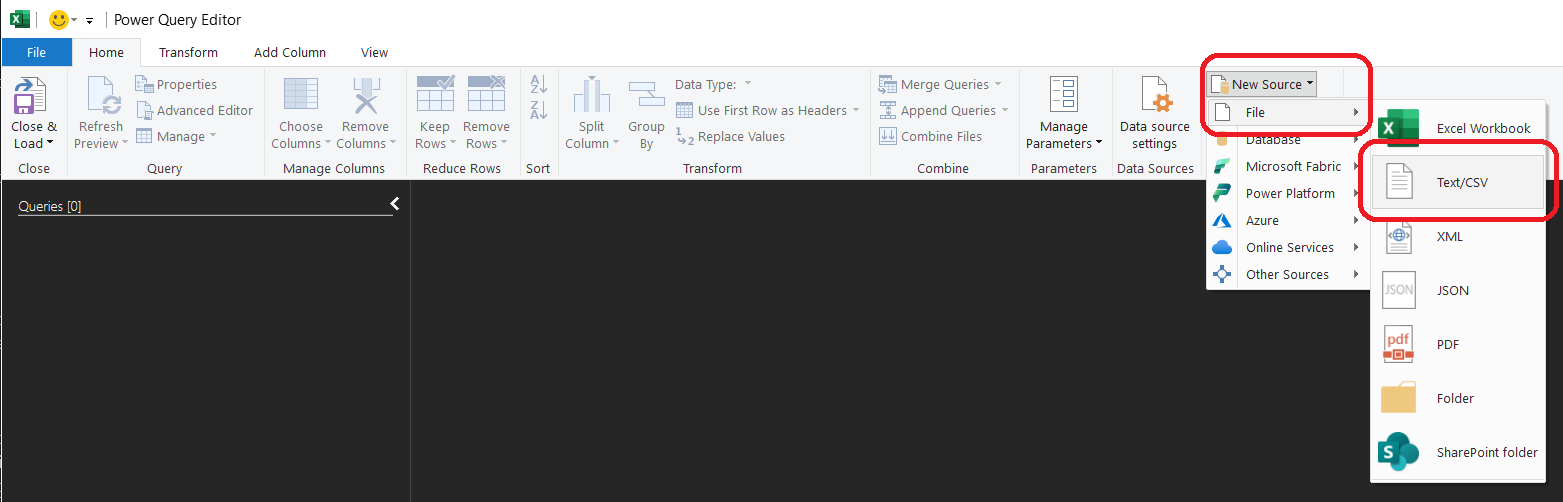
In Excel, go to the Data tab and choose Get Data, then From File, then From Text/CSV. This opens Power Query, Excel's import and transform tool.
1.2 — Select JEA Detail.txt
Browse to the JEA Detail.txt file you downloaded and open it.
1.3 — Check the import preview
Power Query shows a preview. Confirm the delimiter is set to Tab. Notice the File Origin box near the top, which is the encoding, and which Power Query detected for you automatically. Remember that it had to be set, because in Part 2 nothing will detect it for you. The messy header lines at the top are expected. Click Transform Data, not Load, to open the Power Query editor.
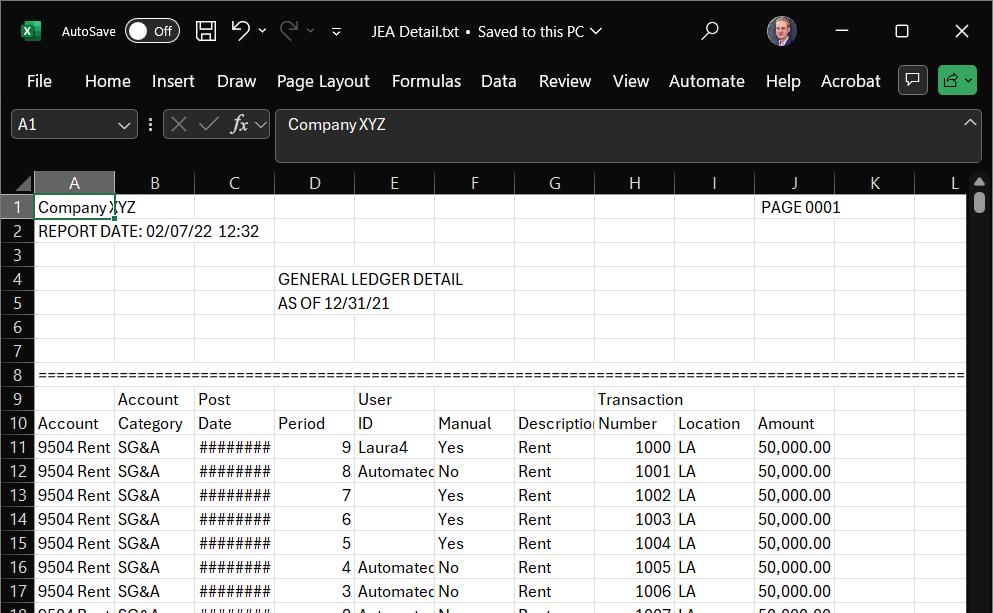
1.4 — See the raw data in the editor
The Power Query editor now shows every row, including the junk. The first several rows are the report header, and somewhere below them the real column headers and data begin.
1.5 — Remove the report header and the extra header line
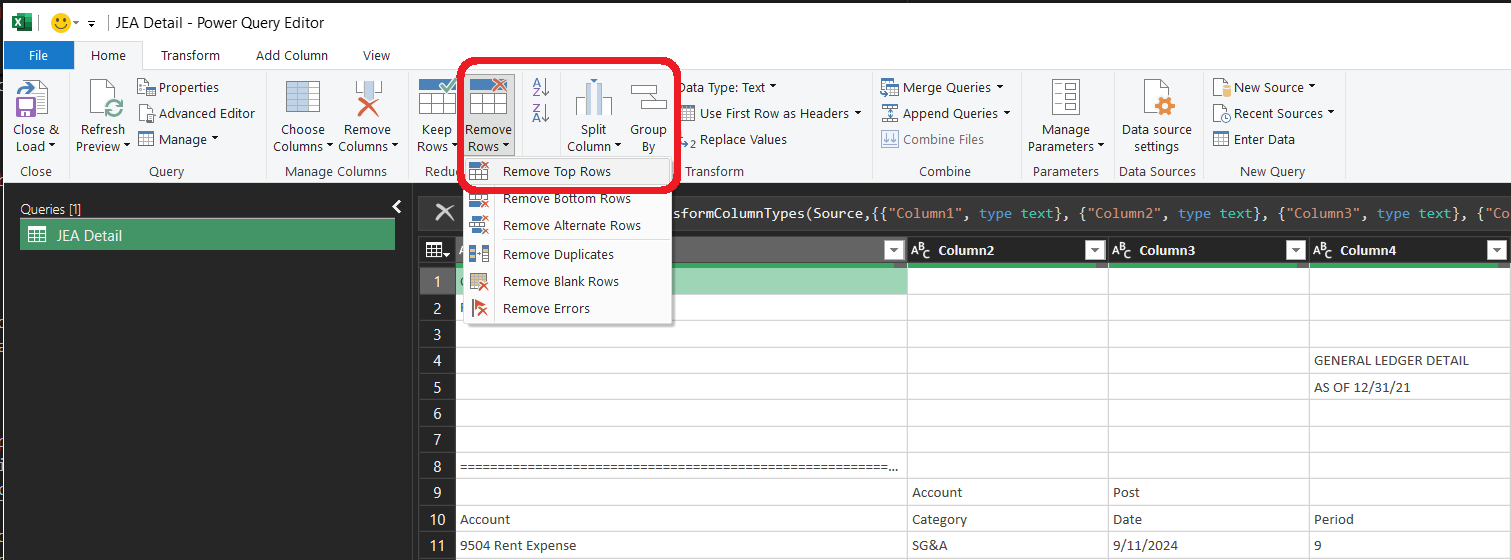
Two things sit above the real data: the report header, and then the upper of the file's two header lines. On the Home tab, use Remove Rows, then Remove Top Rows, and delete every row above the complete column-header line, the one reading Account, Category, Date, Period, ID, Manual, Description, Number, Location, Amount. Leave that complete line as the first row.
1.6 — Promote the header row
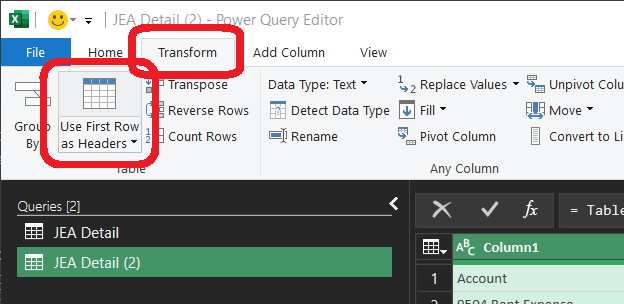
The first remaining row is now the complete column-header line. Use Use First Row as Headers so Account, Category, ID, Amount and the rest become actual column names instead of data.
1.7 — Remove the page-break rows, fix the columns, and load
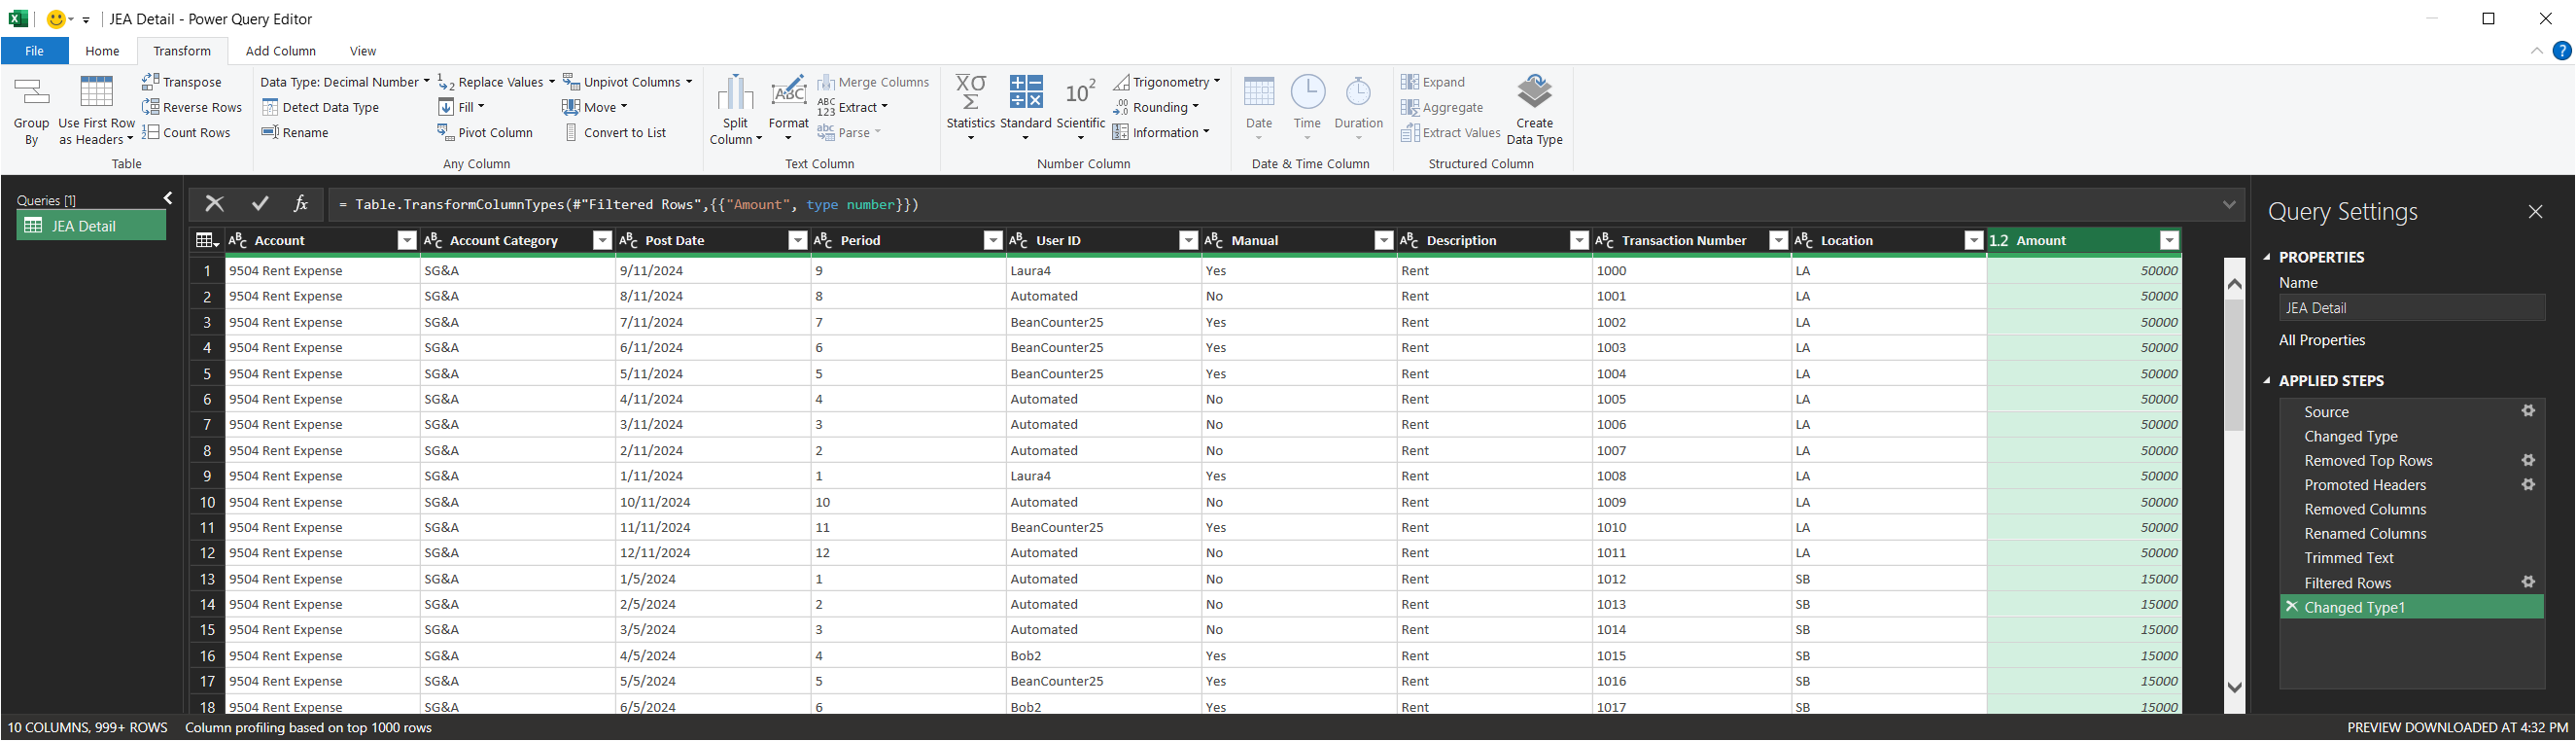
The page-break rows are scattered through the data. Each is a row of ==== or
a row reading PAGE and a number, with the rest of that row empty. The simplest way to drop
them is to filter on a column a real journal entry fills. Filter Category and remove the
blank (null) rows. Page-break rows are blank in Category, so they fall out, and real entries
stay.
Then set each column's data type. Click the small data-type icon to the left of the
column name in its header and choose the type, with Amount set to Decimal Number and the
date column set to Date. Setting Amount to a number is the step that strips the quotes,
spaces, and comma from values like " 50,000.00 ", so do not skip it.
Before you load, clean the ID column. Select the ID column, then on the Transform tab choose Format, then Clean. That removes the non-printing character described above. Doing it here rather than on the worksheet means it becomes one more line in your Applied Steps list, which is one more line you can describe in your Part 2 specification.
When the step list on the right looks complete, click Close & Load.
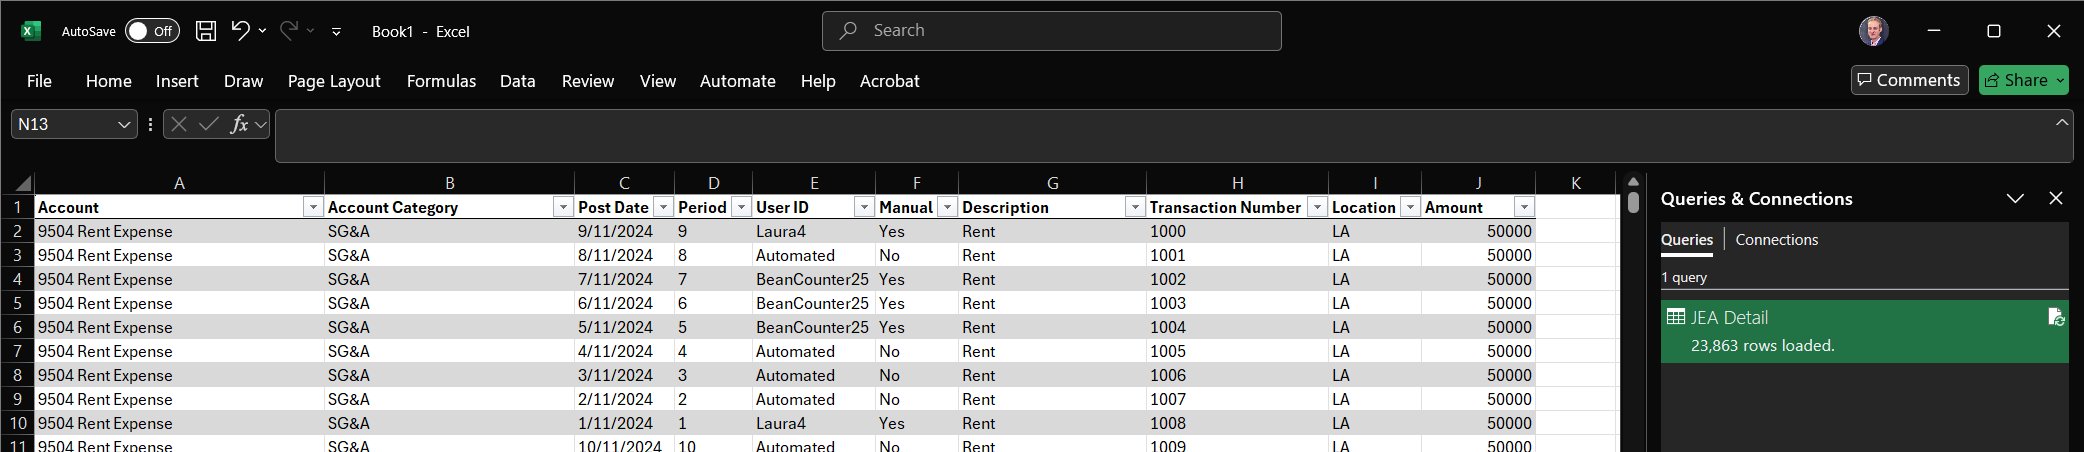
1.8 — Count the journal entries for each user
On your cleaned table, you now need a count of how many journal entries belong to each user, which is the ID column. The straightforward way is a PivotTable. Select your table, choose Insert, then PivotTable, put ID in the Rows area and ID again in the Values area, where it will summarize as Count. You get one row per user with a count beside it.
CLEAN function does the same job, and TRIM does not,
because TRIM only removes spaces. Either way, your Part 2 specification has to
name this operation, because the Python script has to do it too.
If PivotTables are new to you, there is a short practice tool in the Week 2 module, and the Week 2 lecture covers them.
CLEAN. Save both in the workbook you will upload.
Part 2 — Direct an AI to do the same job (25 points, plus 15 for the specification)
Now you get the same result a second way. You write a specification, and an AI builds a Python script that carries it out. You are not going to write Python, and you are not expected to read it. Your job is the specification, meaning the precise instructions that make the AI build the right tool.
2.1 — Write your specification
Everyone writes the specification first, then picks one of two flows to turn it into a working script. Open the Lab 2 specification template, linked here and in the Week 2 module. It follows the same pattern as your Week 1 spec document, with a file manifest, the Build Requirements, review and acceptance criteria, the grading rubric, and a self-assessment gate. The template marks which parts are filled in for you and which you write.
A task specification has five components: Input, Operations, Edge cases, Expected output, and Verification. In this lab you write the first three, Expected output and Verification are filled in for you in the template, and the part graded on precision is Build Requirements. Each piece maps to something you already did in Part 1.
- Input. What the file is. A tab-separated text export of journal-entry detail. State its encoding, the one you wrote down in Part 1, and name what is wrong with it: the report header, the two-line column header, the page-break rows, the quoted and spaced amounts, and the non-printing character in the ID column.
- Operations. The cleaning steps, in order. Describe to an AI what you did by hand in Part 1, have it draft a numbered step-by-step, then correct it. Load the file with the right encoding, skip the report header and the upper header line, promote the complete header row, drop the page-break rows, turn the amounts into real numbers, strip the non-printing character out of the ID column, then count the journal entries per user. Order matters, so say which comes first.
- Edge cases. The specific traps, named exactly: the encoding, the
two-line header and which line to keep, the page-break rows meaning the
====and PAGE lines, the quoted and spaced Amount values, and the non-printing character in the ID column. For each one, say what should happen. - Expected output and Verification. Filled in for you. The ten clean
columns, a printed descriptive summary, the two files the script writes
(
lab_02_cleaned.csvandlab_02_user_counts.csv), and the check that the script's per-user counts match your Part 1 result.
Save your finished specification as lab_02_spec.md. A Markdown file is just
plain text, so any text editor works, and a PDF is accepted too. You will upload that same
file to the quiz and hand its text to the AI in the next step.
2.2 — Choose your flow
Two routes turn your specification into a working script. They reach the same place, a
working lab_02_analysis.py and the two CSV files, so pick the one that matches
what you have on your computer. The prompting steps in 2.3 are the same either way.
Flow A — Google Colab, nothing to install
Use this if you do not have Python set up. Everything runs in your browser and you need a free Google account.
Open the Lab 2 starter notebook in Colab
- Open the starter notebook above, or start a blank one with File, then New notebook, if you would rather set it up yourself.
- Direct an AI to build the script, using the three moves in 2.3. Colab has a built-in AI assistant. If it is not available on your account, use any AI assistant and bring the script back.
- Paste the finished script into a code cell and run it with the round run button or Shift and Enter. The script reads the data file from the web address in 2.3, so there is no upload step.
- Get your files out before you close the notebook. Open the Files panel on the left,
confirm
lab_02_cleaned.csvandlab_02_user_counts.csvare there, and download both. Colab clears that folder when the session ends. Then use File, then Download, to save the notebook as.ipynb, or download the code as.py.
Flow B — Codex or ChatGPT with local Python
Use this if you already have Python installed and want to work on your own machine, with a terminal agent such as Codex or with the ChatGPT app.
- Make a folder for the lab and save your specification into it.
- Direct the AI to build
lab_02_analysis.pyin that folder from your specification. - Run it from a terminal with
python lab_02_analysis.py. In both flows the script reads the data file from the web address in 2.3. The copy you downloaded for Part 1 is for Excel, and pointing the script at it instead is the most common reason two students get different results. - When you run it, paste the output, or any error, back to the AI so it can refine the script against your specification.
2.3 — Direct the AI to build the script
Whichever flow you chose, directing the AI takes more than one prompt. Use the three moves below in order. Students most often skip Move 2, which is where you pin down the files the script has to write.
Move 1 — Hand over the spec and set the job
Give the AI your specification and tell it plainly what to build.
Move 2 — Pin down the output
A script that runs is not the same as a script that produced what you need. Tell the AI exactly what the script must hand back.
Those two CSV files are how you check the work.
lab_02_user_counts.csv is what you compare to your Part 1 by-hand result, and
lab_02_cleaned.csv is what the Output Validator inspects.
Move 3 — Build and run
Have the AI produce the script, then run it, in your Colab notebook for Flow A or in your
terminal for Flow B. If you want to know what pandas is doing, the pandas primer is a short,
plain-language reference. You are not asked to write the code, only to recognize it. When the
script is final, save it as lab_02_analysis.py, or keep the
.ipynb notebook you ran it in. Either one is accepted.
You do not need to understand the Python yet. That is Part 3. For now your job is the specification and the output it produces.
2.4 — Run the script and check it against your by-hand result
Run the script. It prints a descriptive summary, so read that first and confirm it gives you three things: a cleaned-row total, a distinct-user total, and a count per user. Then check the output two ways.
- The Output Validator. Open the
Lab 2 Output Validator and upload
your
lab_02_cleaned.csv. It runs eight checks, listed at the bottom of that page so you know what it is looking at. A clean pass means no leftover header rows, no page-break rows, and Amount stored as a number rather than text. Do this before you start Homework 2, because the homework runs on this file and most of its numbers come out wrong if anything is still in there. - The by-hand result. The real check. Does the per-user count in
lab_02_user_counts.csvmatch the count you built by hand in Part 1?
If the script cannot read the file at all, that is almost always the encoding. The encoding primer covers it.
2.5 — If it does not match, fix the specification
A mismatch does not always mean the AI failed. Usually it means your specification left something vague or unsaid, though it can also mean your by-hand count in Part 1 had a small slip, and the hidden-character trap in the ID column is the likely spot. Re-check both sides, then find the requirement that caused the gap. Common culprits:
- The spec never named the encoding, so the script could not load the file.
- The spec did not say how to identify the page-break rows, meaning the
====and PAGE lines, so the script kept some and the validator flags them. - The spec did not mention the two-line header, so the script promoted the wrong row.
- The spec did not mention the non-printing character in the ID column, so a user's count row came out blank or broken.
Do not just re-prompt and hope. Name the requirement in your specification that was missing or unclear, fix that line, and rebuild the script. Reflection 2 asks you for that named change.
- Your specification has Input, Operations, and Edge cases filled in.
- The script runs and writes both CSV files.
- The Output Validator reports no issues on
lab_02_cleaned.csv. lab_02_user_counts.csvhas the same IDs, with the same count for each one, as your Part 1 PivotTable. Row order does not matter.
Part 3 — Understand what you built (18 points)
You directed an AI to build a script, and the script produced a number you are about to submit. You do not need to be able to write the Python, but you do need to understand what it does well enough to explain it. This part is how you get there.
3.1 — Bring your learning profile
In Week 1 you wrote about_me.md. Section 4, on how you learn and what makes
concepts stick, describes how you actually absorb new material, and it is what turns a
generic walkthrough into one built for you.
Upload the whole file. Attach about_me.md to the same chat you
are about to use, alongside your script. That is easier than copying one section out, and it
gives the model the rest of your profile to work with: what you already know, which tools you
have never used, and what you are studying for. An explainer written against all of that lands
differently from one written against a paragraph.
If your Section 4 is thin, take two minutes now to add real detail about how you learn. That detail is what makes this part work. If you would rather not share the whole file, paste Section 4 on its own and carry on.
3.2 — Get an explainer, built the way you learn
Do not just ask the AI to explain the code. Ask it for options and steer. The goal is a single self-contained HTML page that walks through how each part of your script works, in the format that fits how you learn.
These prompts show you how to ask. The wording is yours, and you fill in the brackets.
Read the five options. Pick the one that fits how you learn, and refine it.
If none of them fit:
When you have the explainer, save it as lab_02_explainer.html. Ask the AI to
give it to you as a single downloadable HTML file. If it gives you the HTML as text instead,
paste that text into a plain-text editor and save it with a .html extension.
Open it in your browser to confirm it renders.
3.3 — Keep asking until it is clear
An explainer you do not understand is not finished. If a part does not land, say exactly what does not land, and ask again.
lab_02_explainer.html that
explains your own script, it opens in a browser, and you could walk a classmate through what
the script does without reading the code aloud.
The three reflection questions (15 points)
The Lab 2 quiz includes three short reflection questions. Answer all three with specifics, pointing at your own work rather than at generalities.
- What was wrong with the raw file, and which defect would most quietly break an analysis if someone missed it.
- How your specification changed when you checked the script against your by-hand result, naming the one requirement you added or sharpened. If it matched on the first run, say what in your specification made that happen.
- Explain, to a non-technical colleague, what your script does and why its number can be trusted.
Grading rubric
100 points. The rubric below groups the three reflection questions into one row, so it has five rows where the quiz has seven items, and the quiz asks for your specification second rather than last. The totals are the same either way. Most of the lab points are earned by completing each part in good faith and showing your work. Clear, proofread writing is expected throughout, to the standard of the Example Managing-Up Document.
| Component | Pts | Credit when |
|---|---|---|
| Part 1, your cleaned workbook | 25 | The file is cleaned in Excel or Power Query, and the workbook shows the clean ten-column table and a correct per-user count. |
| Part 2, the script and the check | 25 | A working script is submitted, as .py or .ipynb, and its
per-user count was checked against the Part 1 by-hand result. If the counts
differed, the mismatch was diagnosed to a specific requirement and the spec
corrected. If they matched on the first run, Reflection 2 names what in the spec
made that happen. |
| Part 3, the explainer | 18 | The explainer page is submitted, is about your own script, and walks through what the script does step by step in plain language rather than pasting the code. |
| The three reflection questions | 15 | All three answered, in your own words, pointing at your own work. |
| The specification | 15 | Graded separately, on precision. The detailed criteria are in the specification template itself. Check your spec against that rubric before you submit. |
| The closing questions | 2 | How long the lab took you, which AI tools you used and how. Any answer earns the points, and the tools question is worth nothing at all. I use these to see where the week is actually costing you time. |
Need help?
- The script will not load the file. This is almost always the encoding. Re-read what your text editor showed you in Part 1, make sure your specification states it, and see the encoding primer.
- Reference pages and tools. The encoding primer, the pandas primer, and the Output Validator are linked through this page and posted in the Week 2 module.
- No Excel. Use Google Sheets as a substitute, or check out a laptop from the University Library. See the note in Part 1.
- Stuck running Python. Google Colab needs no installation. If you hit an error, paste it back to the AI and ask it to walk you through the fix. Troubleshooting with an AI is a skill this course wants you to build.
- A worked example will be posted after the due date, so you can compare your approach once everyone has had the chance to work it out.
- AI policy. See the course syllabus. Use any AI assistant available to you.
- Questions. A Canvas Inbox message is the fastest way to reach me.